Supporting national and sub-regional emergency planning and preparedness.
Supporting national and sub-regional emergency planning and preparedness.

Guyana's National Disaster Risk Management (DRM) Policy details the national priorities for DRM with integration of Climate Change Adaptation as a key tenet for reducing disaster risk.
The policy outlines the international frameworks that underpin Guyana's Comprehensive Disaster Management (CDM) approach and the institutional arrangements for prioritisation of DRM across all sectors.
Implementation of the CDM Strategy is aligned with Agenda 2030 - the Sendai Framework for Disaster Risk Reduction (SFDRR), the Sustainable Development Goals (SDGs), the Paris Agreement on Climate Change as well as Rio+20.
The analytics in this example support Operational Readiness and Recovery for disasters in the CDM Strategy and quantifying global indicators of the SDGs and Sendai framework including:
- Number of deaths, missing persons and directly affected persons attributed to disasters per 100,000 population.
- Direct economic loss attributed to disasters in relation to global gross domestic product (GDP).

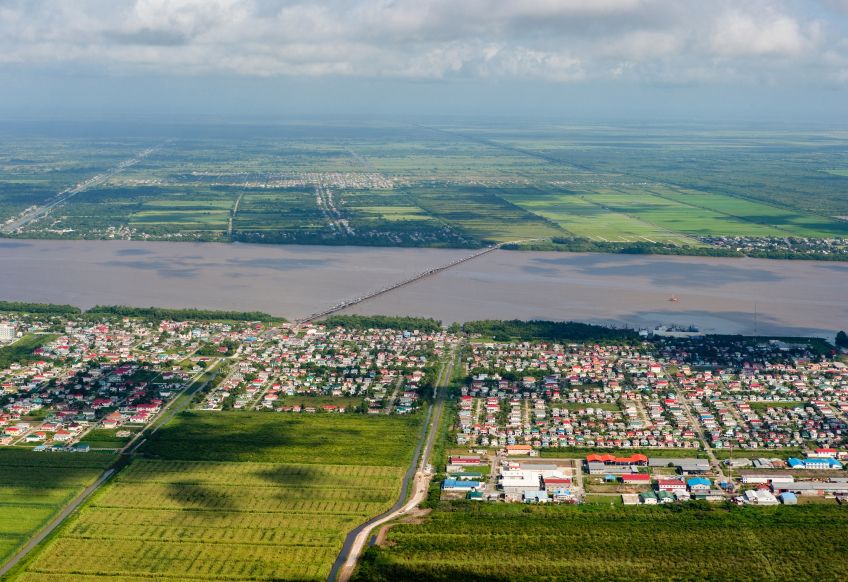
Guyana is vulnerable to a variety of meteorological and hydrometeorological hazards, with flooding being the most commonly occurring.
Significant hurricanes occur on average twice a year, coastal flooding also creates significant impacts on the low-lying coastal plains, with frequent inundation from high tides and storm surges.
Inland flooding is seen as the most damaging hazard, often occurring with the onset of storms, and the priority hazard in all nine regions for which risk assessments have been conducted.
In January 2005, in the country’s worst disaster to date, torrential rains caused catastrophic flooding along the coastal region affecting almost half of the population (290,000 people) and causing US$ 465 million of damage (c. 60% of GDP)
In the changing climate, Guyana may need to consider how it increases investment in disaster anticipation and response as part of a wider risk management strategy to reduce disaster impacts.
Preparedness and planning for early warning anticipatory and response action for floods and hurricanes.
Some of the risk questions for preparedness and planning anticipatory action and emergency response in Guyana are:
- How many people are exposed and likely to be impacted by storms and flooding of different severity across Guyana?
- Of those people, what proportion are considered especially vulnerable and may need specialist support and response?
- Which regions are most affected and may require additional budgetary allocations?
- How might the risk change over time due to climate and socio-economic change, and what will this mean for resource requirements?
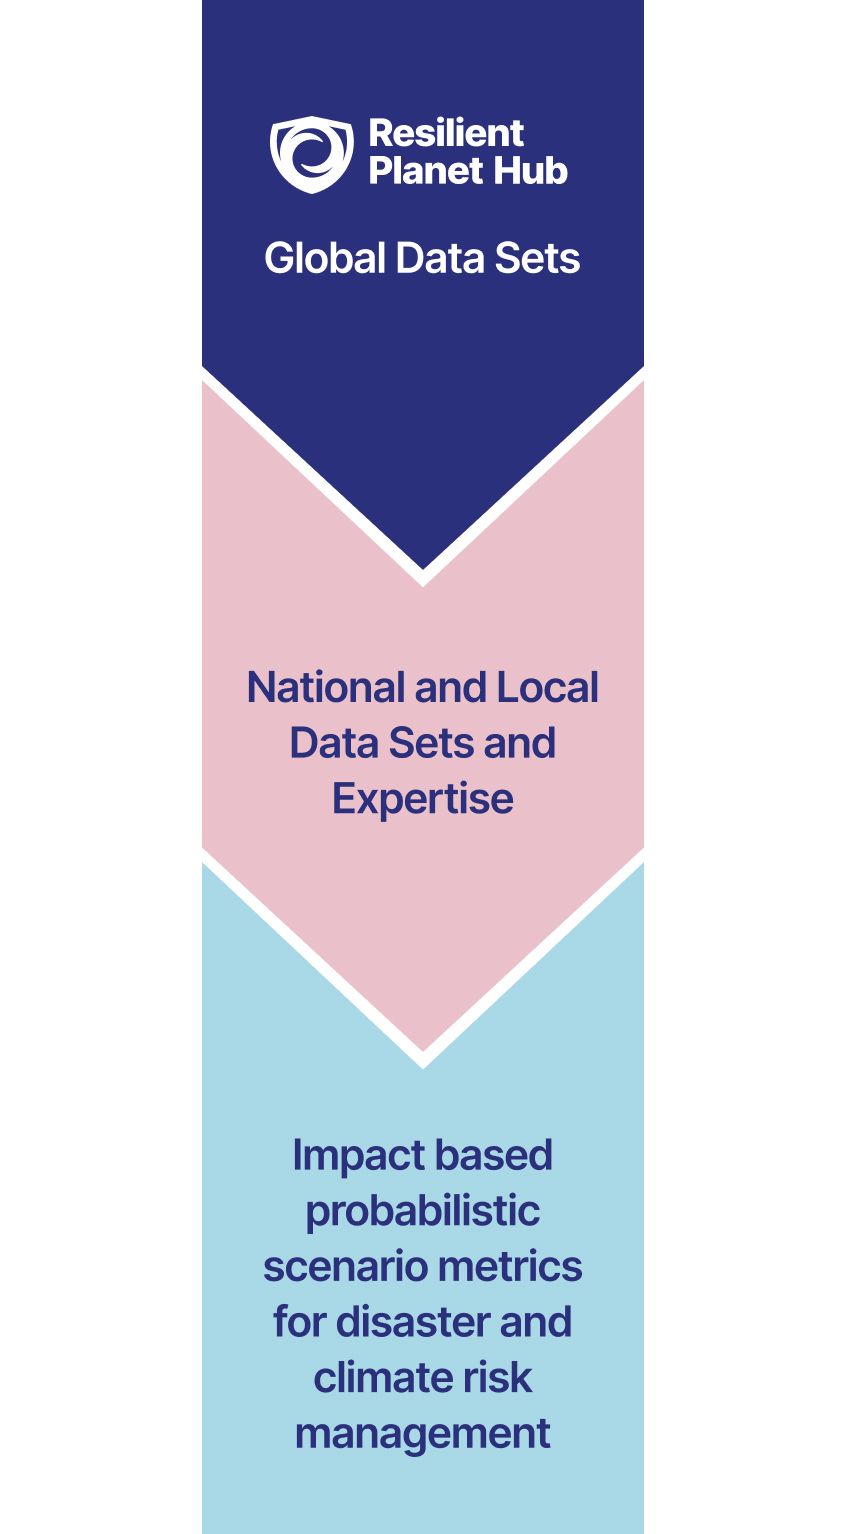
Scenario-based and probabilistic risk analysis, such as provided by the Resilient Planet Data Hub, can inform preparedness and emergency response planning to develop effective anticipatory action and contribute to faster recovery.
These analytics can also help to understand how requirements may evolve with climate change and inform investment decisions that can ensure the protection of citizens of Guyana in the longer term.
Analytics provided by the Resilient Planet Data Hub, coupled with local data and information can provide quantitative estimates of risk and impacts of potential disaster events.
This type of information is important for taking risk-based decisions at national and subnational levels on preparedness and emergency response planning.
National level decisions will likely be strategic, ensuring sufficient financing for future events, directing resources based on level of risk, and informing national adaptation planning.
Subnational level decisions are likely to be more tactical and operational, including:
- Likely shelter requirements in extreme events,
- Evacuation routing, transportation and support,
- Supply and prepositioning of emergency items,
- Emergency response and rescue coordination and debris and casualty management
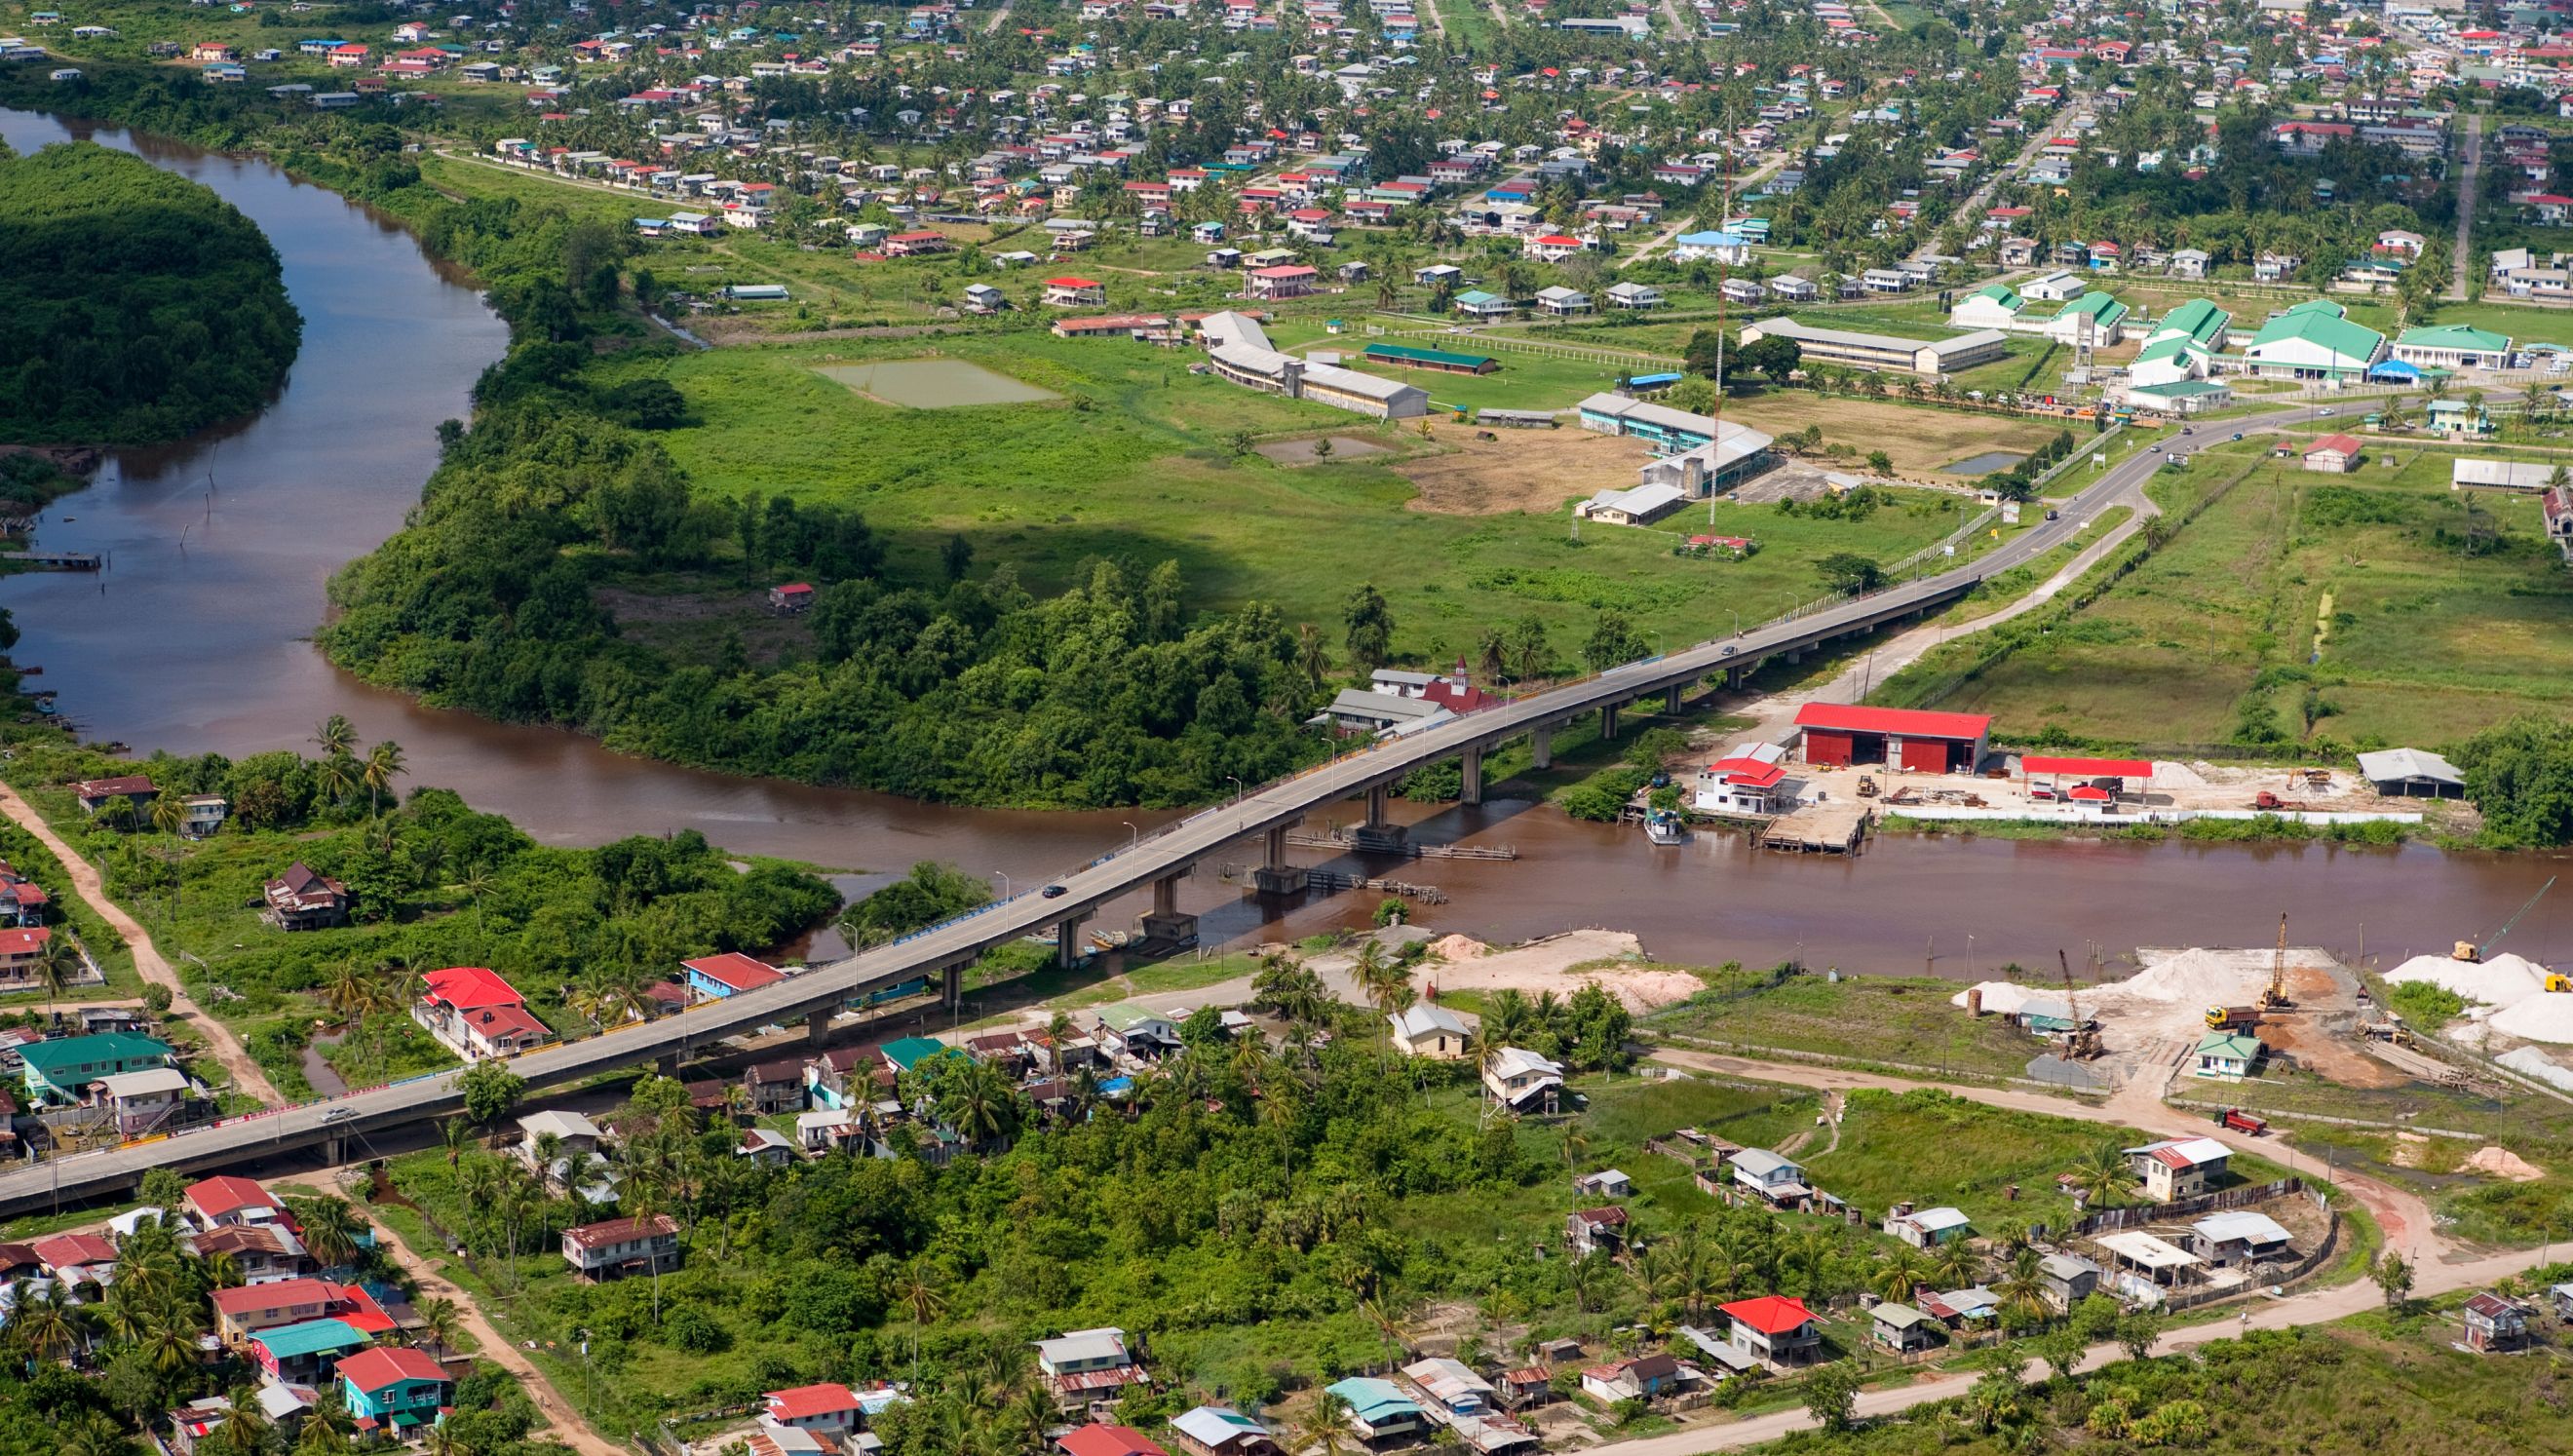
New Amsterdam West Berbice Guyana
This analysis uses global-scale, freely available data and an open-source analysis method to provide initial screening of risk from floods and storms in Guyana. Return period hazard maps, exposure (population and built-up land) data, and global vulnerability/impact functions are combined to understand the number of people exposed, fatalities, and proportion of urban land exposed and damaged.
To generate the risk estimates below, the high-level exposure and modelling of built-up land and people impacted by floods and storms was coupled with the national population data. This enabled the development of a risk profile of the impact on people including those with specific needs emergency needs, including children, older people, people with disabilities.
More granular national or subnational data is needed to base these numbers in the local context and answer questions like:
- Can risk estimates from the global data be validated using local information on historical events and if not, what adjustments are needed to the global analysis?
- How many of the exposed population are older people, children, or disabled who may require greater assistance? And how much is that likely to cost?
- What might people need support for in different phases of a crisis e.g., early warning period, response, recovery?
- What metrics and thresholds provide effective triggers for anticipatory action in an impact-based forecasting framework, in which risk information coupled with national forecasting agencies' real-time forecasts?
Results
Buildings exposed and impacted
Risk has been estimated in terms of hectares (Ha) of built environment that could be impacted by flood events of different severities. This is shown as a percentage of the total built-up land nationally and per region (Administrative level 1). This was then coupled to national census data to estimate the number of buildings exposed and damaged.
People exposed and potentially impacted
The number of people exposed to flooding of differing severity has been estimated. Global historical flood mortality rates were used to estimate the number of fatalities. This is shown as a percentage of the total population nationally and per region (Administrative level 1). By linking this to national census data, estimates were made of the number of male and females, people in different age groups, and disabled people exposed.
Why is this important?
Understanding through data how many people and who those people are likely to be in need of emergency support in different severities of event is critically important for well informed emergency preparedness and planning.
Flooding - National view
The following graph demonstrates on a national level the number of people likely to require emergency assistance due to floods of varying severity and frequency.

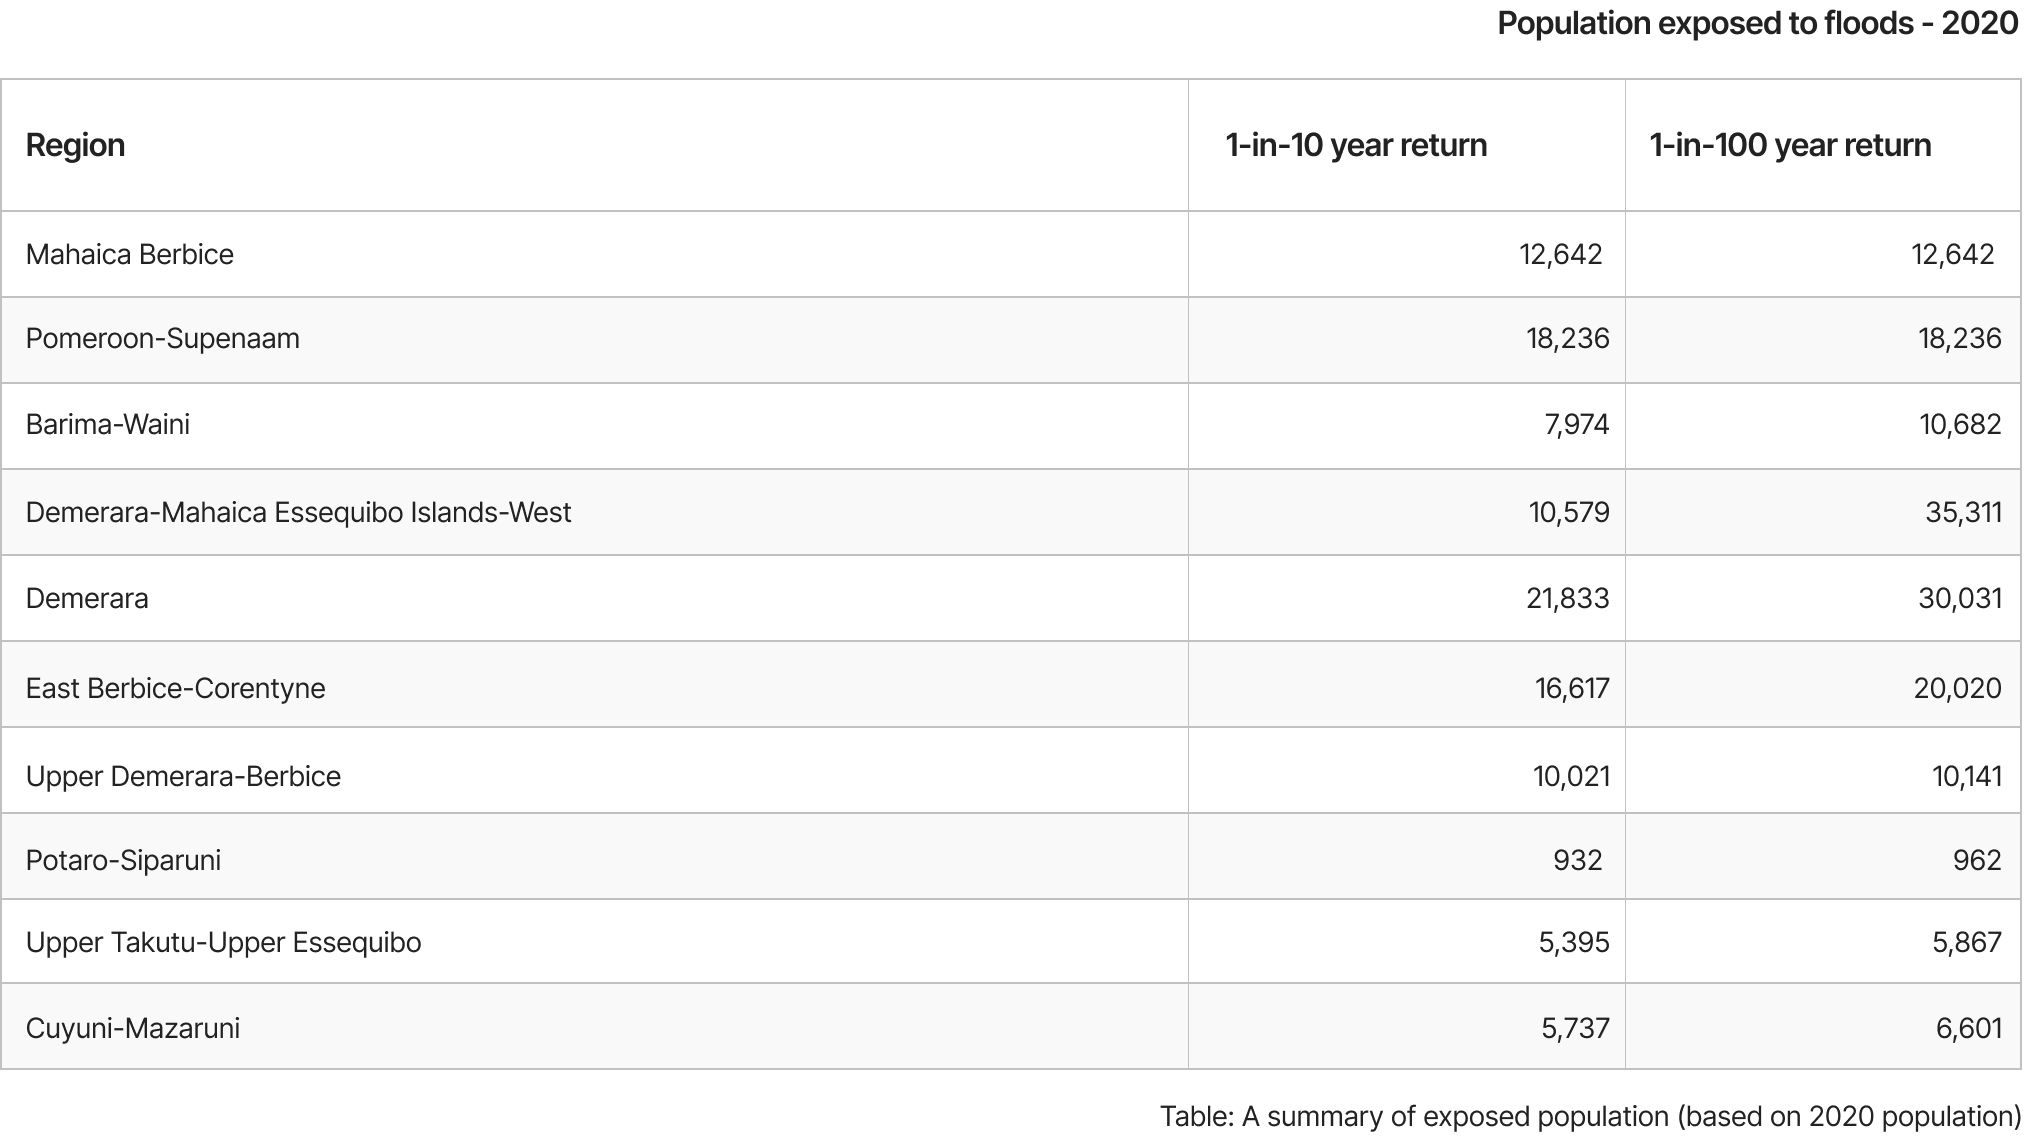
Table: A summary of exposed population (based on 2020 population)
Number of people exposed to flooding and expected fatalities:
The national flood exposure and fatalities estimates provide an indicative number of people who may need emergency support in frequent and rare events. This data does not replace the need for ground verification (i.e. collecting data on numbers affected in events occur) it is a useful benchmark for national planning on how preparedness and response needs will be met, and what level of funding is required.
The number of buildings likely to be exposed and damaged is useful for planning resources for sheltering internally displaced people whose homes are uninhabitable for a period of time, clearing debris, managing potential public health incidents, and planning for resilient recovery.
Population exposed to floods across all regions - 2020
How a sub-regional emergency manager could use our data to support their decisions.
Subnational emergency planners and risk reduction decision makers can review credible emergency scenarios that they could be faced with, from low severity frequent events with which they are likely most familiar, to rare high severity events they may have little experience of.
In the results presented for individual regions, there is a breakdown of number of people exposed and fatalities that could be expected in each region. This can facilitate local planning and pre-agreement of shelter provision, with flood hazard maps being used to identify suitable shelter buildings away from flood-prone areas.
Breakdown of population exposed by age and sex provides important planning data as this affects planning of specific provisions such as infant milk, food and medications, support for elderly mobility and medications, and other disability support. Further localised information and know-how will further enhance this type of scenario modelling and planning.
This granularity of risk information helps to quantify the required fiscal budget to meet potential emergency needs of people to ensure well-being and dignity in emergency operations. With this risk information as evidence of potential impact, these considerations can be integrated into further disaster risk financing provision and prepositioning of resources for anticipatory action.
For example, the chart and table below show the estimated number of potentially flood-damaged buildings and population exposed to frequent and rare flood events in Barima-Waini.
Barima-Waini - Buildings Damaged
Legaan Island, Guyana
Projecting future risk
Guyana’s Second National Communication to the UNFCCC presents concerning projections of increased temperatures, increased rains during the wet seasons and less precipitation during dry seasons. Further, continued sea level rise will likely contribute to worsening coastal floods along Guyana’s coast.
The potential increased impact of hurricane activity and flooding in the future may require additional investment to reduce risk and ensure sufficient emergency preparedness and support operations, and analysis available from the Resilient Planet Data Hub can help to plan for those long-term trends in risk.
Climate-conditioned modelling can provide estimates of the change in population exposed, fatalities, built-up area and number of buildings damaged to assess the same metrics for the future, as already presented for the current situation. These analytics can also estimate the substantial changes in risk that can result from socio-economic change including population growth and urban development.
In this example a moderate climate scenario in which greenhouse gas emissions peak around 2040 and then decline (Intergovernmental Panel on Climate Change RCP4.5) is used, and the highest baseline emissions scenario is shown as an extreme case (RCP 8.5).
Population growth alone between 2020 and 2030 is estimated to result in a slightly higher proportion (6% more) of the national population being exposed to flood, while fatalities remain relatively unchanged.
Flood risk can decrease, as well as increase, due to climate change and it is important to investigate regional variations.
This analysis suggests that climate change will increase flood risk to the population of some regions, while decreasing the risk in other regions.
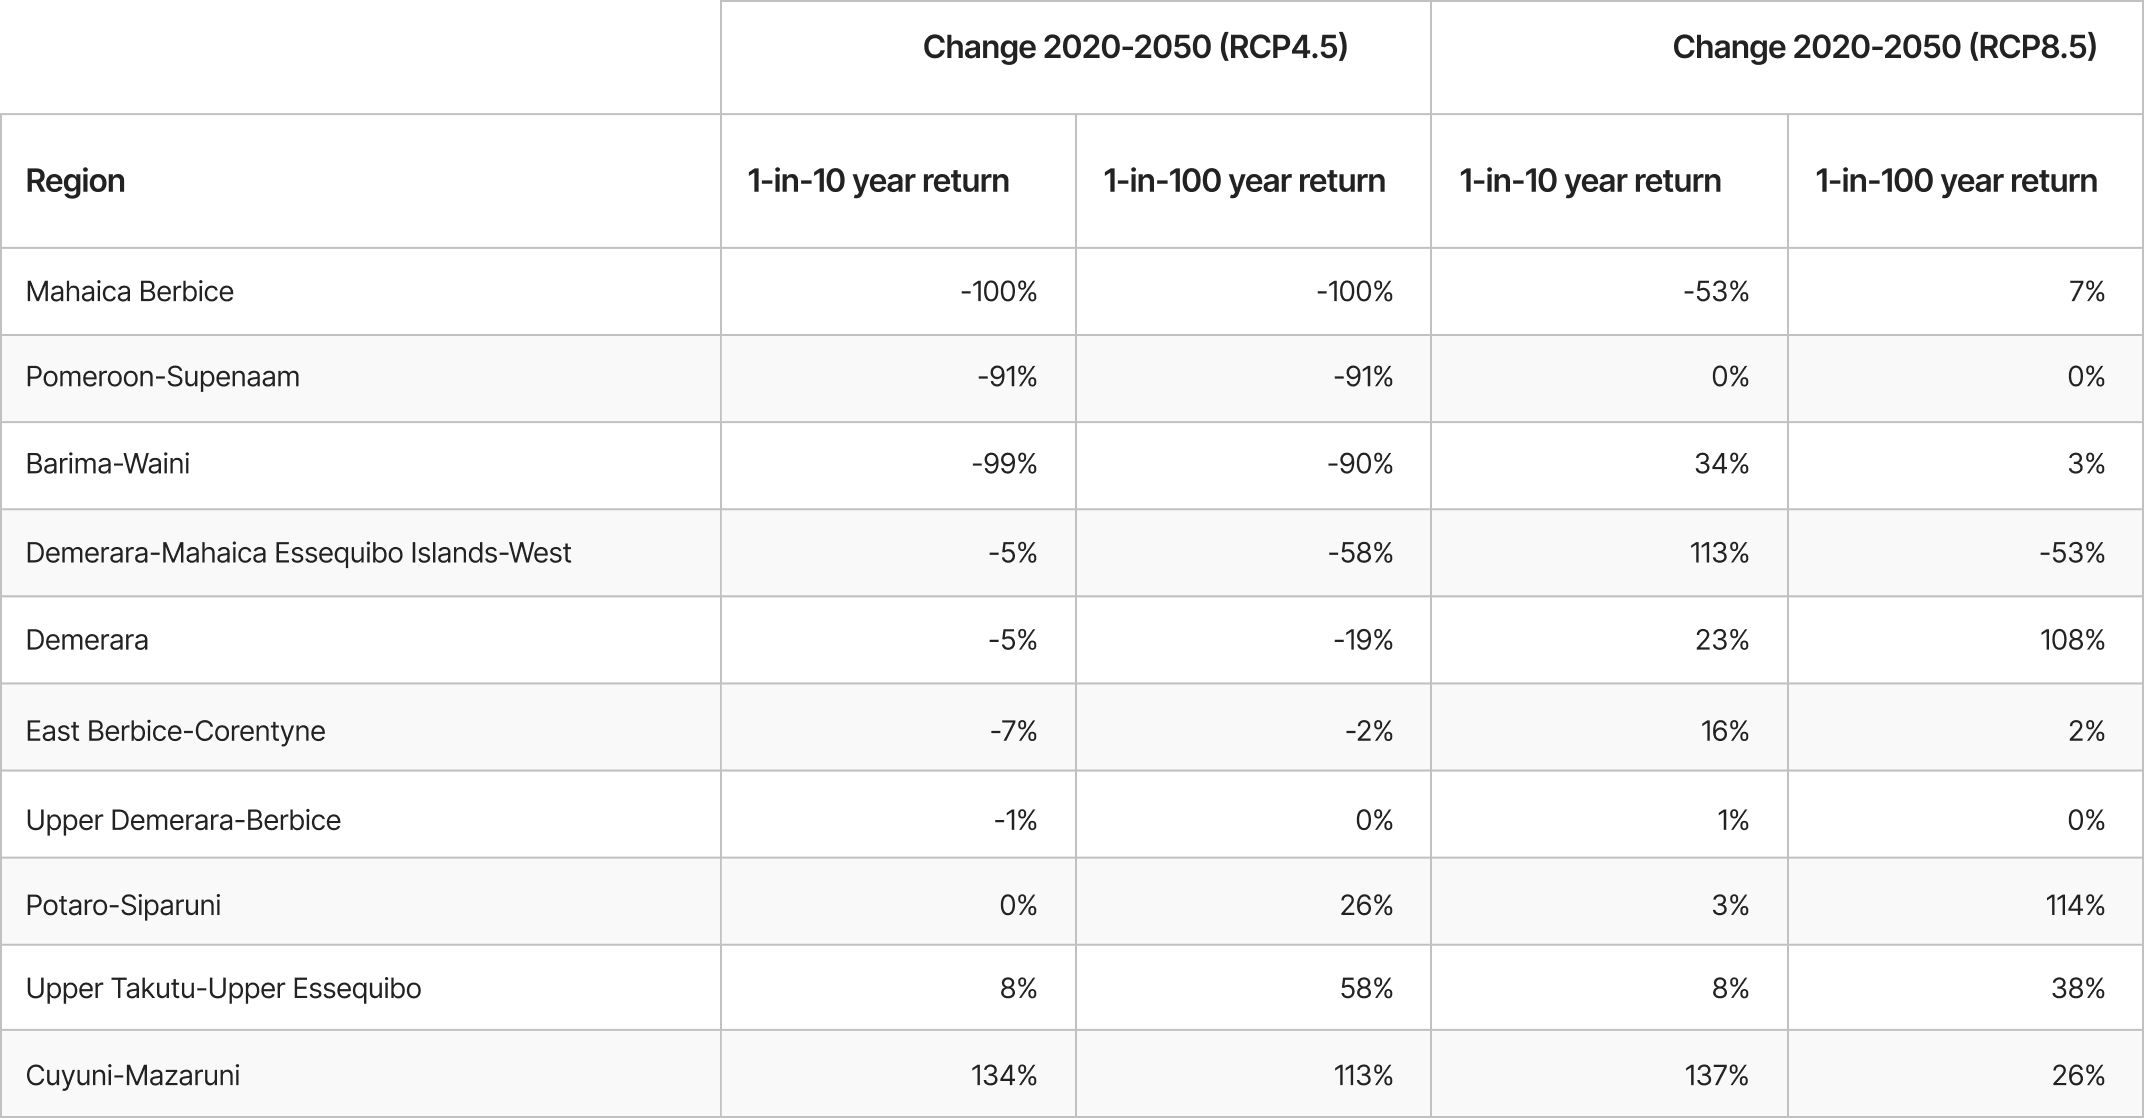
Table: Projected in population exposed to floods under two future climate scenarios.
Between 2020 and 2050 there is potentially a 30-40% reduction in population and built-up land exposed to flooding nationally, under the moderate climate change scenario.
This large change is driven by a reduction in flood hazard in the coastal plains, particularly in Barima-Waini, Mahaica Berbice, and Pomeroon-Supenaam regions.
Elsewhere, in Cuyuni-Mazaruni region exposure is expected to double, and in all other regions the change is much smaller. In an extreme scenario, the number of people and built-up land exposed could increase by 25-30%.
However, fatalities could be 3 times higher and there could be nearly double the built-up land damaged per year, largely due to increased flood depths in frequent events.
These projections of risk indicate the potential for significant scaling of need for emergency response and recovery resources by 2050.
This analysis has not considered changes in demographics and vulnerability, which could cause a greater increase in response needs than shown here, due to a shift in demographics towards an older population, for example.
This analysis only considers inland river flooding - the risk from multiple hazards may experience other changes not captured in this example.
Real world applications for this data
The Resilient Planet Data Hub provides transparent climate risk insights, for today and future conditions, which are valuable for many applications.
This example has demonstrated their application in preparedness and emergency response planning.
Risk insights based on global data (as used in this example) can be used to screen risk at national and subnational level and provide a first step in understanding risks and needs.
They must be used with more granular information to informed specific planning and investment decisions, however, to better reflect reality on the ground.
Additional to the uses in this example, similar analysis can answer complementary risk questions and inform related actions to support resilient infrastructure systems, shock-responsive social protection, climate and disaster risk financing and insurance (CDRFI).